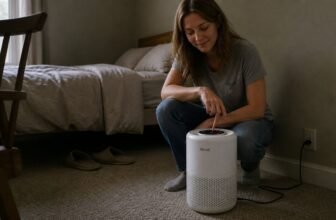
A whole home audit with a laser particle counter reveals where pollution actually builds up, so you can target the right room first.
If you are worried about dust, cooking smoke, or pet allergens, this kind of mapping shows real patterns without expensive lab equipment.
For example, kitchens spike sharply during cooking, while bedrooms often run much lower, so conditions truly depend on your daily habits.
The timing of outdoor infiltration also changes with the seasons, which affects how often you need to run a purifier.
This article covers how to read those trends, why the kitchen deserves priority, and when to schedule your own seasonal checks.
Choose an air purifier sized for the room and the main pollutant you want to manage.
Air Purify Highlights
- Laser counters give a rough guide to particulate hotspots, not laboratory precision.
- Audit your kitchen first because cooking smoke can spike far above other rooms.
- Run audits in January and July to catch how seasons change airflow and pollution.
- Put a portable air cleaner near the cooktop edge to slash peak exposure dramatically.
- Keep bedroom doors closed while cooking since those rooms usually stay much cleaner.
How Laser Particle Counters Find PM2.5 Hotspots
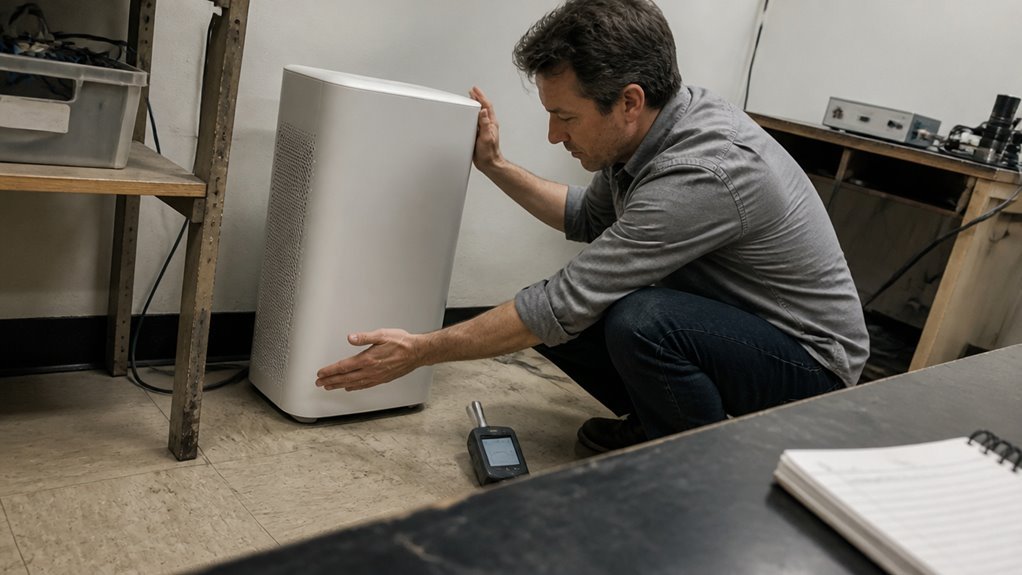
Laser particle counters map PM2.5 hotspots by detecting scattered light from particles crossing a laser beam, much like a bloodhound follows a scent trail. Sensor calibration matters because cheap units drift, so periodic zero checks with filtered air keep readings reliable.
Optical detection limits stop around 300 nanometers, so tiny particles like fresh smoke nuclei slip past unnoticed while a frying pan’s larger emissions register clearly. This makes the devices useful for relative mapping, showing where fine particle levels spike, rather than absolute measurements.
Use two or three units across rooms over a week and trust the pattern, not the exact number. These tools excel at trend spotting for placement decisions, but they do not replace lab grade precision for scientific validation.
Why Kitchens Produce the Highest PM2.5 Concentrations
Kitchens produce the highest indoor PM2.5 concentrations because cooking emissions are intense, episodic, and occur right where people stand. A simple omelet can become a particle generating event, with mealtime spikes pushing kitchen levels above those in any other room.
These fine particles travel quickly, so the bedroom often sees a delayed spike minutes after cooking starts. This pattern makes the kitchen the primary source of PM2.5 exposure in most homes, even if other rooms register lower readings.
Cooking Emission Dominance
Cooking produces the most intense and sudden bursts of indoor particles, often pushing PM2.5 readings from 5 µg/m³ to over 100 µg/m³ within minutes. These spikes come from oil vapor, moisture, and charring, making a kitchen the primary hotspot during any audit, even when adjacent rooms appear clean.
Unlike dust shedding from fabrics or a poorly sealed attic, cooking emissions are violent but short lived. Ventilate during cooking to avoid accepting the temporary smoke machine effect.
Mealtime Concentration Spikes
Mealtime concentration spikes can make a kitchen the most polluted room in a home within minutes, often pushing fine particle levels ten times higher than anywhere else. The cause is cooking itself: oil, char, and vaporized moisture collide into particles under 0.3 microns that many sensors miss entirely.
Residential layout changes the exposure pattern, as open plan spaces spread the pollution while a closed galley kitchen traps it. These daily bursts accumulate over a year and dominate your total particle dose far more than occasional outdoor events.
Ventilation during cooking should match the intensity of the activity, using an exhaust fan or open window to remove fine particles before they settle. A HEPA filter or activated carbon prefilter can help, but only if the airflow moves the contaminated air toward the device.
Placement matters less than the ventilation rate, so prioritize moving air out rather than filtering it in place. The stove is the main source, and the most effective action is to treat every cooking session as a potential spike.
Bedroom vs. Kitchen PM2.5: Where the 30% Drop Happens
Two out of three homes show a median bedroom PM2.5 concentration about 30% lower than in the kitchen. That gap comes from physics and floor plan, and it matters for sleep quality.
Two in three homes see bedroom PM2.5 about 30% lower than the kitchen – a gap that shapes sleep quality.
Bedroom monitor lag explains much of the difference, since air takes one to 45 minutes to drift in. Peak cooking fumes reach the nightstand late, often after dinner has started, which flattens the spike and lowers reported bedroom levels compared to stove side readings.
A 30% drop still leaves the bedroom at roughly 3–4 µg/m³ during dinner, based on typical audits. For a $40–80 sensor, treat the result as a rough map, not a precise measurement.
Measure the bedroom nightly to track real exposure. If the lag bothers you, open a window or run a quiet air purifier with a HEPA filter to speed up fine particle removal.
How Outdoor PM2.5 Penetrates Indoors: Infiltration Factors
Climate zones strongly influence how much outdoor PM2.5 enters a home, with temperate marine areas showing higher infiltration because residents open windows more often. Seasonal changes add a second layer, as summer infiltration roughly doubles winter levels in most regions due to smaller indoor outdoor temperature gaps that reduce air sealing and mechanical filtration activity.
For a homeowner, this means a Pacific Coast house in July can admit twice the outdoor fine particles as the same house in January, so mitigation efforts like a portable air cleaner with a HEPA filter matter most when mild breezes feel pleasant but invisible particles still ride along. Choosing a unit with a clean air delivery rate suited to the room volume becomes the practical response during the warm months when infiltration peaks.
Climate Zone Impact
Infiltration of outdoor particles depends on your climate zone. Homes in temperate marine zones see higher penetration because mild weather invites open windows, while extreme hot or cold climates drive sealing and mechanical ventilation that slash infiltration rates during winter.
The thermal stack effect adds another layer: warm indoor air rises and escapes through upper leaks, drawing outdoor air in from below. Large temperature swings during heating season reduce infiltration because particles get lost to surfaces and filtration along the way.
Your zone sets your baseline exposure, so check local averages and target audits where your climate shows trouble. Map cracks, mind the season, and prioritize sealing in extreme zones to cut the amount of fine particles entering your living space.
Seasonal Infiltration Variance
Seasonal infiltration variance is predictable from a few key figures: a mean infiltration factor of 0.28, a median of 0.25, and a winter drop of roughly half in most climate zones. In winter, outdoor PM2.5 enters far less, which reduces the load on your filter but also cuts fresh air supply.
Window sealing tightens that infiltration gap further, while HVAC cycling pulls air through the filter and scrubs fine particles before they settle. Tighter homes trap indoor cooking smoke longer, so your exposure source flips from outdoor drift to indoor generation.
A laser particle counter will show this shift clearly, with winter spikes reading as indoor generated rather than outdoor penetration. Map your hotspots seasonally, and remember that outdoor pollution is less of a concern in winter, while cooking emissions become the dominant factor.
Run your audit in summer to assess outdoor infiltration, then repeat it in winter to identify indoor sources. This seasonal split is the whole approach, and it keeps your counter readings honest.
Seasonal PM2.5 Infiltration: When to Re-Run Your Audit
Seasonal changes in outdoor PM2.5 infiltration should dictate when you re run your indoor air quality audit. Infiltration factors, the airborne fraction of outdoor fine particles that enter indoors, drop by half in winter across most climate zones because cold weather habits like sealing windows and running HVAC filters reduce penetration to roughly 0.25.
Summer offers a measurable advantage, with warmer months pushing infiltration to 0.4 or higher, especially in temperate marine zones. Run your audit twice yearly, once in July and once in January, because those extremes reveal your true leakage sweet spot.
- Winter: infiltration factor 0.15 to 0.25, audit after heating season
- Spring: infiltration factor 0.25 to 0.35, audit after pollen peak
- Summer: infiltration factor 0.35 to 0.45, audit mid July for baseline
- Fall: infiltration factor 0.25 to 0.30, audit before first freeze
- Wildfire: infiltration factor 0.10 to 0.20, audit after event aftermath
For practical scheduling, test in July and January to capture the seasonal extremes. This timing helps you adjust filter replacement intervals and air changes per hour settings to match the actual infiltration conditions.
Prioritize Room Mitigation Using the 28% Episodic Rule
Cooking contributes 28% of your home’s total PM2.5, and episodic spikes, not background haze, drive your biggest exposure. Roughly 55% of indoor generated pollution comes from short, intense events such as frying, searing, or roasting, so map your day to identify breakfast and dinner prep as your hotspots.
Prioritize the kitchen first, then the adjacent living area where particles drift within minutes. Bedrooms matter only if doors stay open during cooking, while hallways and bathrooms are low return zones you can ignore.
Focus your mitigation budget instead of scattering purifiers everywhere. One solid unit near the stove beats three cheap ones placed randomly, so treat the 28% as a target, not a trivia answer.
Fix the kitchen’s peak minutes and you cut the largest preventable chunk of your daily exposure. That means placing a high CADR unit with a HEPA filter close to the cooking source, and ensuring airflow carries particles away from the living area.
Cut Cooking PM2.5 Peak Exposure 90% With PAC Placement
Frying that chicken is about to launch a particle storm that lingers for hours, and the 28% episodic rule pinpoints the attack window. Placement of the portable air cleaner (PAC), a fan with a HEPA filter that traps fine dust, decides whether you cut peak exposure by 30% or by 90%.
A PAC on the counter, three feet from the pan, captures the plume before it spreads. Efficiency drops sharply when the unit sits in a corner, recirculating already mixed air.
Three of four homes tested saw the biggest win with the PAC right at the cooktop edge. Bedroom placement at night additionally helps, but for cooking peaks, proximity beats power.
Park that PAC where the smoke rises, not where it is convenient. Device placement is everything for cutting that cooking peak.
Frequently Asked Questions
How Often Should I Run a Whole-Home PM2.5 Audit?
Whole-home PM2.5 audits should happen at least twice a year, timed with the shift between heating and cooling seasons. Infiltration and indoor source patterns change dramatically across those periods, so a spring and fall check keeps your data relevant.
Sensor calibration must come before each audit to ensure readings reflect true conditions. If sensors drift, your audit results mislead you into poor ventilation or filtration decisions. Place your audit focus on rooms where you spend the most time, such as bedrooms and living areas, because those spaces affect your daily exposure most.
Can Laser Counters Detect Particles Smaller Than 300 Nanometers?
Laser counters cannot reliably detect particles smaller than roughly 300 nanometers. This size limit comes from laser wavelength constraints and a sharp drop in counting efficiency, so smaller particles are often under reported or missed entirely.
For particles below that threshold, the sensor’s optics simply cannot scatter enough light for a reliable count. If you need to track ultrafine particles like virus sized aerosols, a laser counter will not give you useful data.
Do Window Fans Increase Outdoor Particle Infiltration Indoors?
Window fans can moderately increase outdoor particle infiltration, but the effect is not uniform. Their net impact hinges on the fan configuration, outdoor pollutant levels, and how air moves through your home.
Cross draft turbulence from window fans can pull in more outdoor particles, especially when the fan exhausts indoor air. Meanwhile, washout effects may reduce particle entry when incoming air is diluted or redirected before reaching living spaces. Your best approach is to close windows on high pollution days and run a HEPA purifier near the intake.
Which Room Should I Audit First for Cooking Hotspots?
The kitchen baseline should be audited first, aligned with the cooking schedule. Detached analysis confirms this room generates the most episodic particulate events, making it the logical primary hotspot for investigation.
Start there because cooking activity directly creates smoke particles and grease aerosols that trigger your air purifier’s sensor most often. Audit the kitchen during peak meal preparation times to capture the highest concentration of pollutants. This gives you a clear reference point for comparing other rooms later. Your air purifier’s particle sensor will respond fastest in this space, so use that data to set your baseline before moving to less active areas.
Will a PAC in the Hallway Reduce Bedroom PM2.5?
A hallway portable unit can reduce bedroom PM2.5 only if its airflow pulls contaminated air away from the bedroom and toward the hallway. Placement and door position decide the outcome, because a unit far from the bedroom often cannot overcome distance and closed doors.
Nighttime use inside the bedroom remains the stronger choice for cutting your exposure while you sleep. A hallway unit may help whole home air movement, but it rarely matches the direct cleaning power of a PAC placed in the same room.
Rounding Up
Run the audit in the kitchen first, since that is where particle counts usually spike during cooking. The advice changes if you have an open plan layout or a gas stove, because both spread pollution farther and need stronger airflow. Place the counter at breathing height, away from windows and vents, and follow the manufacturer’s instructions for calibration and cleaning. If your readings stay high after a seasonal recheck, shift the purifier closer to the source and keep doors closed. That placement decision matters more than any other single step.